A Comprehensive Guide to Gold Price Trends
This article explores the history and factors influencing gold price fluctuations, including notable peaks in 2011 and 2016, and highlights seasonal trends. It provides valuable insights for investors and enthusiasts interested in gold market dynamics and economic indicators.
A Comprehensive Guide to Gold Price Trends
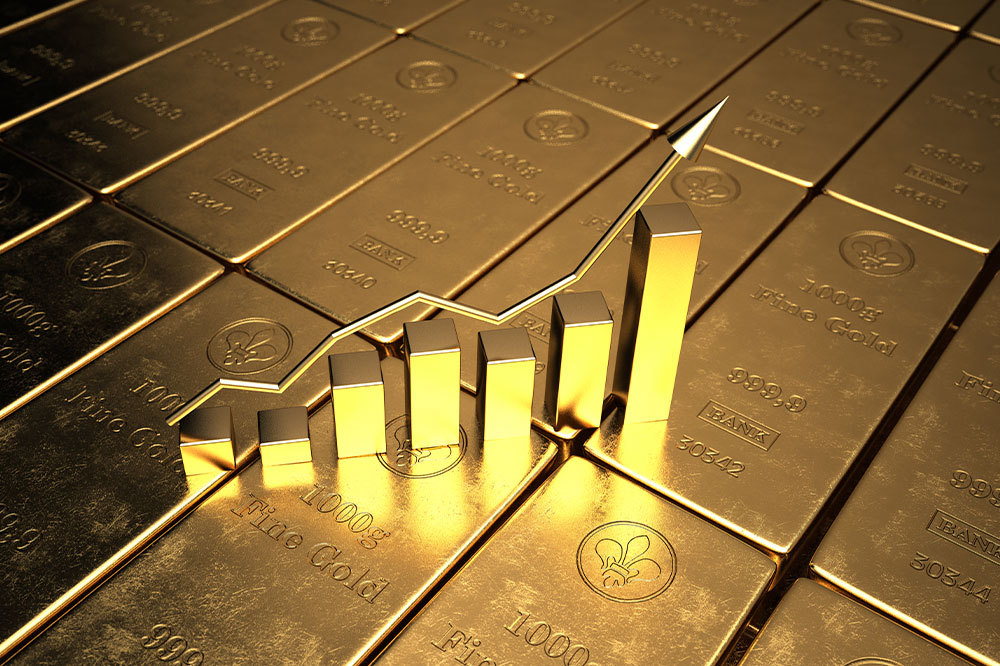
Back in August 2011, gold prices skyrocketed to an unprecedented $1,900 per ounce, marking an all-time high. Initially, experts remained calm about the rapid surge, but concern grew as prices climbed swiftly. At the start of that year, gold was valued at $1,400 per ounce.
On August 22nd, during after-hours trading, gold reached $1,900, peaking at $1,917.90 on August 23 before settling at around $1,880.
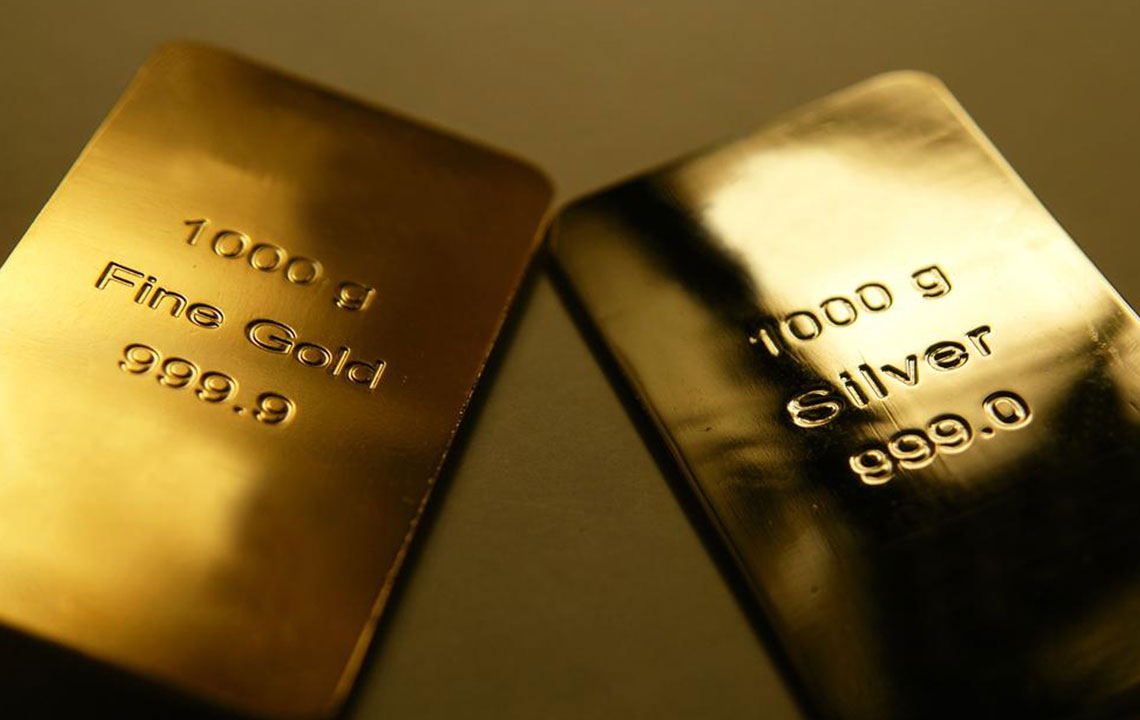
Earlier that year, silver experienced a similar rapid increase before falling sharply, highlighting a period of intense market volatility. Gold has long been considered a safe haven against inflation. However, the dramatic rise in gold prices significantly outpaced inflation, which averaged just 2.4% annually over a decade, while gold soared roughly 21% yearly.
Market analysts link these sudden spikes to debt issues faced by the US and Europe. Another notable peak occurred in February 2016, when gold’s value soared to 44 times that of oil, amid an unprecedented oil price collapse. Experts also note that gold prices tend to rise during Chinese New Year, highlighting a seasonal trend worth monitoring.